Handling of Microwell Plates
Dedicated functions for live cell imaging in microwell plates
In large-scale live-cell imaging experiments, microwell plates often provide the underlying structure for the experimental setup.
This is especially common in commercial high-throughput imaging platforms.
To support such workflows, seperate LiveCellReplicate and Platemap classes are introduced for organizing and managing large experimental datasets with microwell-plate-based layouts.
While partly losing some of the customizability, this allows for more efficient and clearly structured workflows, enabling direct data transfer from the image dataset to further analysis.
Example code accompanying this section is available
here.
Setting up a Replicate
Throughout this section, we assume that the Experiment my_experiment and a corresponding Results my_result have already been created, i.e. as described in the
previous chapter.
A new LiveCellReplicate can be created using
replicate_1 = my_result.replicate('Replicate1_Name', layout=96)This class manages all information regarding the microwell plate and connects it to the SpheroidCollection structure.
Managing a Platemap
In order to connect this construct with the individual layout of the microwell plate, each LiveCellReplicate is associated with one Platemap.
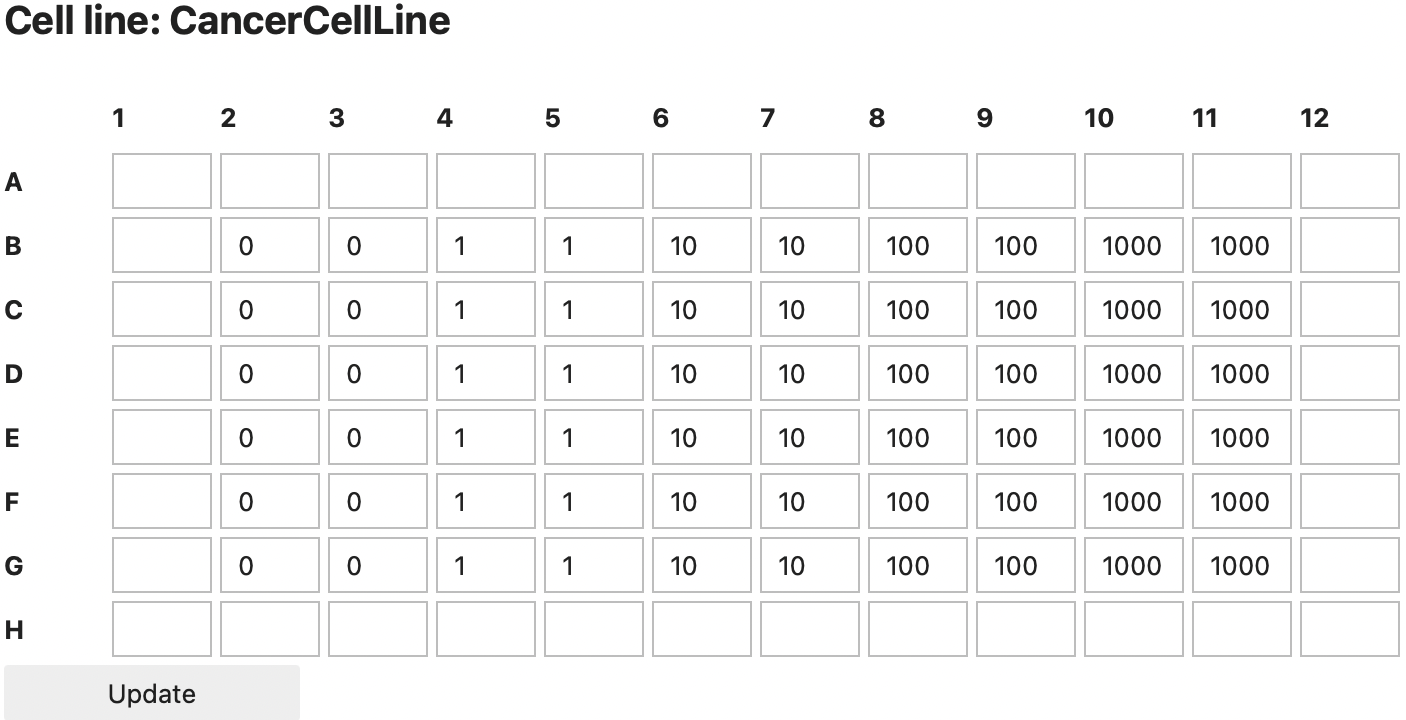
A platemap defines the experimental setup for each well, such as cell lines, compound treatments, and its concentrations. To assign a new cell line to the replicate or modify the values of an existing cell line one can use
replicate_1.platemap.cell_line('CancerCellLine')
# or to directly define multiple concentrations across specific well ranges:
replicate_1.platemap.cell_line('CancerCellLine',
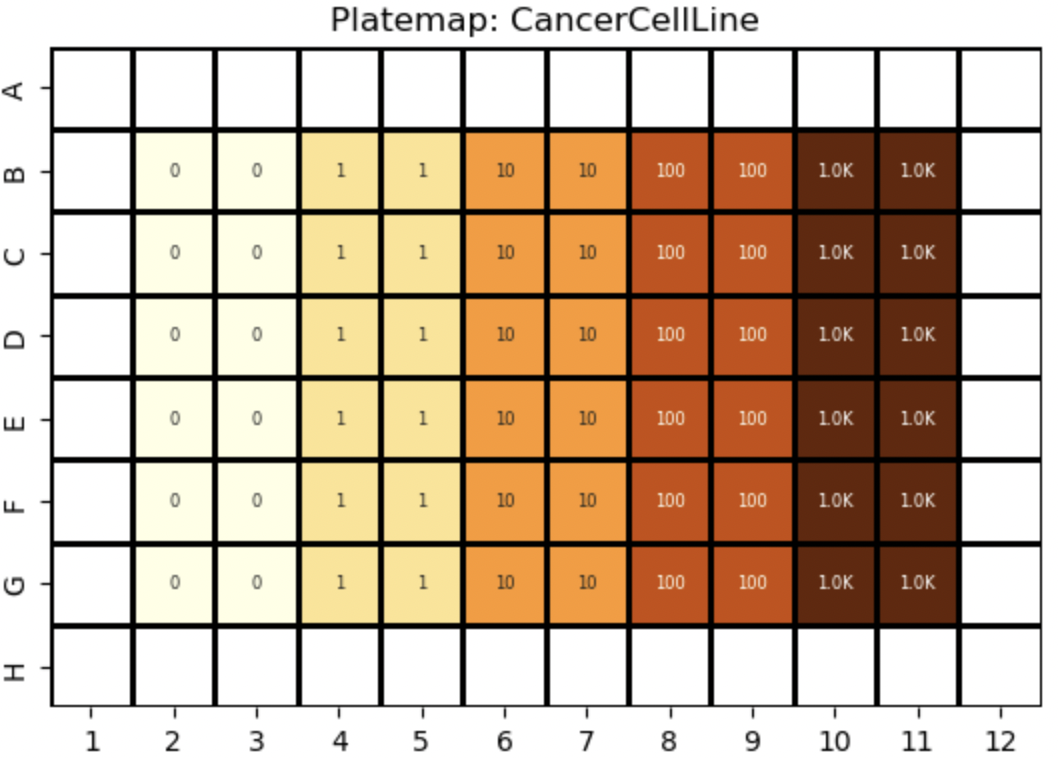
{'B2:G3':0,'B4:G5':1, 'B6:G7':10,'B8:G9':100, 'B10:G11':1000})In a jupyter notebook this will directly open an interactive input window. The resulting distribution will also be displayed.
Similarly, compounds can be defined using the same approach:
my_result.platemap.compound('CompoundName')All wells with identical platemap values are interpreted as one experimental condition. These conditions can be listed using:
my_result.platemap.replicates()which for the previous example returns:
{(('CancerCellLine', 0.0),): ['B2','B3','C2','C3','D2','D3','E2','E3','F2','F3','G2','G3'],
 (('CancerCellLine', 1.0),): ['B4','B5','C4','C5','D4','D5','E4','E5','F4','F5','G4','G5'],
 (('CancerCellLine', 10.0),): ['B6','B7','C6','C7','D6','D7','E6','E7','F6','F7','G6','G7'],
 (('CancerCellLine', 100.0),): ['B8','B9','C8','C9','D8','D9','E8','E9','F8','F9','G8','G9'],
 (('CancerCellLine', 1000.0),): ['B10','B11','C10','C11','D10','D11','E10','E11','F10','F11','G10','G11']}
Loading Data & Segmentation
Once the relevant well positions have been specified, images can be loaded automatically. SpheroidPy therefore searches the selected folder for images that match the naming convention of the specified plate layout. Furthermore, filters can be applied to encounter for different channels.
replicate_1.load_images('path/to/data/folder',
                      ['PhaseContrast_channel_name','channel_name2'], # array of str that label files of each channel
                      ['green_channel_name'],['red_channel_name'],
                      image_size=(1700,1270)) # image size (µm) in x- and y-direction
For all wells with shared values in the specified platemap, a separate SpheroidCollection will be created, as this corresponds to technical replicates of a single condition.
The underlying LiveCellReplicate and Platemap will be permanently linked to the created SpheroidCollection and also stored in the hdf5-file of the experiment, so it can be reloaded or edited with no information being lost.
If individual platemap values are modified later, the corresponding SpheroidSeries objects are automatically reassigned to the updated SpheroidCollection.
Previously introduced operations - such as the segmentation() or metric() methods - remain applicable at the LiveCellReplicate level and are consistently propagated across the hierarchical data structure.
Visualising the Data
The propagated show() method offers an interactive overview of the LiveCellReplicate and its associated Platemap.
It can be used to inspect the plate layout, review segmentation results and evaluate per-well metrics.
replicate_1.show()